In 2016, Perlara and Grace Science Foundation launched a PerlQuest for NGLY1 Deficiency (also known as NGLY1-CDDG). As a part of this collaboration, we have embarked on developing an NGLY1 worm screen. This post will detail the worm team’s latest progress toward that goal.
A brief background on NGLY1
NGLY1 Deficiency is an inherited condition caused by mutations in the gene coding for the N-glycanase 1 protein, or NGLY1. This protein has the very important function of removing sugars from proteins, covered in a previous previous post by our friends on fly team. Mutations in the human gene lead to a host of symptoms: delayed development, lack of tear production, seizures, and liver disease. Worms with mutations in the nematode homolog, PNG-1, however, have no apparent phenotype. Besides growing slightly slower than wild-type worms, there was nothing outstanding in the worms that we could immediately screen with. That is, until the Ruvkun lab reported a hypersensitivity to proteasome disruption in png-1 mutants [1].
The proteasome is a protein complex that degrades the majority of damaged proteins within a cell. In humans, the gene Nrf1 is responsible for upregulating the transcription of proteasome subunits. Upon proteasome inhibition, Nrf1 is deglycosylated and subsequently localizes into the nucleus. The nematode homolog of Nrf1 has been identified as SKN-1, specifically the SKN-1A isoform. By exposing png-1 mutants to incredibly low doses of the proteasome inhibitor bortezomib, Lehrbach and colleagues were able to identify PNG-1 as a major player in this process in worms, where PNG-1 deglycosylates SKN-1A and allows it to be further processed. In the absence of functional PNG-1, Nrf1 cannot be deglycosylated. This manifests as aggravated proteasomal stress leading to larval arrest.
NGLY1 worm screen development
 |
| Figure 1. Our general screening pipeline |
Based on the principle outlined in the Ruvkun paper, our first step toward a screen in the worm pipeline was to replicate this bortezomib sensitivity in our PNG-1 mutant worms. We adapted and optimized the method detailed in the paper for our 384-well screening plates. Due to the low concentrations under which sensitivity was observed, we decided to dispense the bortezomib with our Echo acoustic liquid handler (Labcyte Inc.) in testing the same final concentrations as in the paper. We also dispensed the corresponding volumes of just DMSO to see if the sensitivity reported in NGLY1 flies is also observed in their PNG-1 worm counterparts. The following day, we added bacterial media and sorted fifteen worms of both png-1 mutants and wild-type animals into the wells using the Union Biometrica BioSorter (Figure 1). After six days of growth at 20°C, we immobilized the worms and imaged each well of the 384-well plate. Next, we ran image processing for area occupied by worm per well. If worms were arrested as larvae, the area occupied by them would be smaller than area occupied by worms that grew to adulthood.
| 2A |  |
| 2B |  |
| Figure 2. Replicating bortezomib sensitivity in png-1 mutants
2A. Z score plot of area occupied by worm at different concentrations of bortezomib in both wild-type worms (N2) and png-1 mutants (GR2246). png-1 mutants are sensitive at concentrations as low as 13nM while wild-type worms are sensitive only at concentrations 1000 times greater, 13 µM 2B. png-1 mutants are not differentially sensitive to DMSO between 0.01%-0.1% |
|
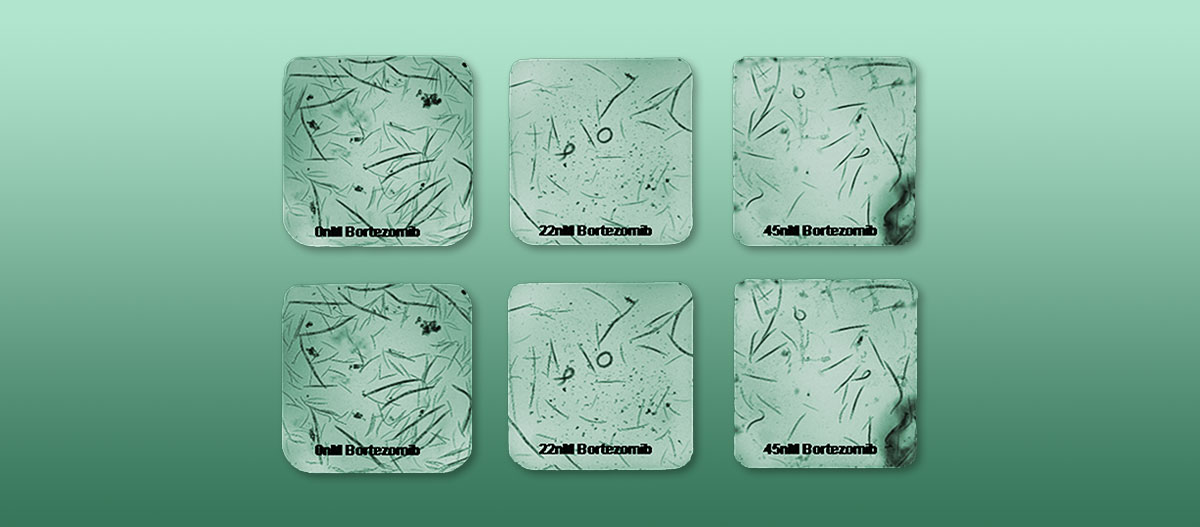
The results were as dramatic as reported. Worms exposed to bortezomib at even nanomolar concentrations (for reference, our drug screens are performed at 25µM concentrations) arrested as larvae while wild-type animals only started showing sensitivity at the highest doses (Figure 2A). Additionally, png-1 mutants didn’t appear to be any more sensitive to DMSO than wild-type animals (Figure 2B). We repeated the experiment under the same conditions as well as over an expanded concentration range to gain resolution with smaller steps in concentration, focusing heavily on the nanomolar range. The results consistently held up: roughly 65nM is the limit before png-1 mutants start exhibiting significant larval growth delay/suppression. We determined that 45nM would be the ideal concentration of bortezomib for our screen; anything lower doesn’t give a large enough suppression from no bortezomib controls, and anything higher is too detrimental to the worms’ health leading to larval arrest or even death (Figure 3). With 45nM of bortezomib, the worms are consistently arrested enough to confidently identify compounds that rescue the growth phenotype.

Figure 3. Representative images of png-1 sensitivity to bortezomib
Raw images taken on worm imager in top row. Corresponding overlays outlining objects included in area occupied by worm calculation in bottom row
Technical difficulties
Before we could embark on a screen, however, we had one base left to cover: we needed to confirm the lack of DMSO sensitivity in the png-1 mutants. While we observed no apparent sensitivity in the DMSO controls throughout the experiments, we really only tested concentrations that corresponded to the amount of bortezomib needed to induce a screenotype. To comfortably rule out a DMSO sensitivity similar to that observed in flies, we decided to repeat concentration curves, this time with the additional DMSO that would be introduced with the drugs from our screening library. Since we screen our libraries at a concentration of 25µM, we added an additional 137.5nL of DMSO to each concentration of bortezomib, maintaining a corresponding “no additional DMSO” control for each as well. This time however, the results were not as straight forward as we had hoped.
We did not see an increased sensitivity to DMSO. We noticed, however, something different in image quantification. Instead of a downward trend of decreasing areas with increasing concentrations of bortezomib, we observed wells with high concentrations of bortezomib with unusually large worm areas represented in the plots in Figure 4. We reviewed the images and found the source of the discrepancy: bacterial clumps, our old nemesis. While we have resolved this issue in different diseases, the use of bortezomib in this screen introduces a third variable. Starting out with proteasomal stress in addition to the png-1 mutation makes these worms grow less than our other mutant strains and consume significantly less bacteria in their lifespan, leading to more bacteria in the well to clump. The image processing algorithm we developed needed to have even more stringent shape restrictions. Luckily, this was a simple fix and, after a few tweaks to the code, our screening pipeline was finally good to go.
| 4A |  |
| 4B |  |
| Figure 4. Tweaking image processing algorithm to recognize bacterial clumps from worms
4A. Plot of raw area outputs from image processing algorithm. Increase in area from 170nM bortezomib and higher are artificially inflated due to clumps of bacteria 4B. Plot of raw area outputs with more stringent size restrictions for calculation of worm area |
|
Screen Time
Now we are basically all caught up with the present day. We have started screening our relatively small Microsource Spectrum Collection and hope to have this completed in a few weeks. In the meantime, we will be ordering 384-well plates in bulk, and coordinating autoclave time before embarking on a 20,000-compound screen early next month. Through these efforts, we hope to identify a small molecule that enables png-1 mutant worms to overcome larval arrest caused by bortezomib.
References:
- Lehrbach JN and Ruvkin G, ‘Proteasome dysfunction triggers activation of SKN-1A/Nrf1 by the aspartic protease DDI-1’, eLife, 2016; 5:e17721
